
Pythonのpandasで平均値や中央値、最頻値を求める方法を紹介します。
今回紹介するメソッドは引数が似ているので使いやすいと思います。
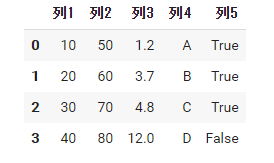
平均値と中央値では以下のDataFrameを使います。
|
1 2 3 4 5 6 7 8 9 10 11 |
import pandas as pd df1 = pd.DataFrame( data={'列1': [10, 20, 30, 40], '列2': [50, 60, 70, 80], '列3': [1.2, 3.7, 4.8, 12], '列4': ['A', 'B', 'C', 'D'], '列5': [True, True, False, False]} ) df1 |
目次

平均値:mean
| 引数 | デフォルト値 | 内容 |
|---|---|---|
axis | 0 | デフォルトで列方向に計算 1で行方向に計算 |
skipna | True | Naやnullを除外して計算する |
level | None | マルチインデックスのレベルを指定 |
numeric_only | None | Trueでint、float、boolの行や列のみ計算 bool値の列はTureの割合を返す。 Falseですべての行や列で計算(エラーの可能性有) |
- averageとmeanの違い
- 一般にaverageもmeanも平均(算術平均:合計を個数で割る平均)と言う意味。
統計学では、averageは他の平均(幾何平均、調和平均など)をまとめての「平均」で、
meanは単なる算術平均としての「平均」として区別されています。
averageは代表値(平均値・中央値・最頻値)と訳されることがあります。
参考:統計WEB「平均」のこと
行や列の平均を求める
|
1 2 3 4 5 6 7 8 9 10 11 12 13 14 15 16 17 18 19 20 21 |
#列ごとの平均(数値だけで計算される) df1.mean(axis=0) #axis=0は無くてもOK ##出力結果 列1 25.000 列2 65.000 列3 5.425 列5 0.500 dtype: float64 ######################### #行ごとの平均(数値だけで計算される) df1.mean(axis=1) ##出力結果 0 20.400000 1 27.900000 2 34.933333 3 44.000000 dtype: float64 |
列5はbool値になっています。('列5': [True, True, False, False])
このとき、Tureの割合を平均として返します。(列5の場合は半分がTrueなので0.5)
numeric_onlyの役割
|
1 2 3 4 5 6 7 8 9 10 11 12 13 14 15 16 17 |
#数値の列だけで計算(なくてもOK) df1.mean(numeric_only=True) ##出力結果 列1 25.000 列2 65.000 列3 5.425 列5 0.500 dtype: float64 ######################### #すべての列で計算(文字列があるとエラー) df1.mean(numeric_only=False) ##出力結果 TypeError: Could not convert ['ABCD'] to numeric |
numeric_onlyなしでも数値だけで平均を計算してくれます。
全て数値になっているかどうかのチェックに使えそうですね。
中央値:median
- 引数は平均(mean)と同じ。
- numeric_onlyの役割も平均と同じ。
- bool値の列はTrue=1、False=0として中央値を計算する。
行や列の中央値を求める
|
1 2 3 4 5 6 7 8 9 10 11 12 13 14 15 16 17 18 19 20 21 |
#列ごとの中央値(数値だけで計算される) df1.mean(axis=0) #axis=0は無くてもOK ##出力結果 列1 25.000 列2 65.000 列3 5.425 列5 0.750 dtype: float64 ############################### #行ごとの中央値(数値だけで計算される) df1.median(axis=1) ##出力結果 0 5.60 1 11.85 2 17.40 3 26.00 dtype: float64 |
bool値の処理
- True=1、False=0に変換(例:列3なら「1,1,0,0」)
- 小さいもの順に並べる(例:列3なら「0,0,1,1」)
- 真ん中の数値を求める。
- 列3はデータが偶数個なので2個目と3個目の平均を求めると0.5
|
1 2 3 4 5 6 7 8 9 10 11 12 13 14 15 16 17 18 |
df2 = pd.DataFrame( data={'列1': [True, True, True, True], #1,1,1,1 '列2': [True, True, True, False], #1,1,1,0 '列3': [True, True, False, False], #1,1,0,0 '列4': [True, False, False, False], #1,0,0,0 '列5': [False, False, False, False]} #0,0,0,0 ) #列ごとの中央値(数値だけで計算される) df2.median(axis=0) #axis=0は無くてもOK ##出力結果 列1 1.0 列2 1.0 列3 0.5 列4 0.0 列5 0.0 dtype: float64 |
数値に変換することさえ知っていればOKです。
中央値の計算方法は変わりません。
最頻値:mode
- 引数はaxis、numeric_only、dropna
- 役割は平均(mean)と同じ
- dropna=FalseでNaNも値とみなす(デフォルトはTrue)
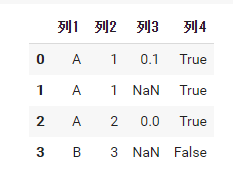
以下のDataFrameをもとに最頻値を求めます。
|
1 2 3 4 5 6 7 8 |
df3 = pd.DataFrame( data={'列1': ['A', 'A', 'A', 'B'], '列2': [1,1,2,3], '列3': [0.1, None, 0, None], '列4': [True, True, True, False]} ) df3 |
|
1 2 |
#列ごとの最頻値 df3.mode(axis=0) #axis=0は無くてもOK |
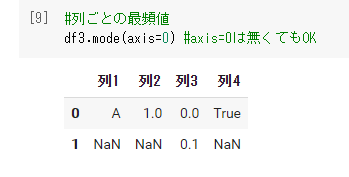
デフォルトではNaNが最頻値としてみなされることはない。
数値だけで最頻値を求める
|
1 2 |
#数値の列だけで計算 df3.mode(numeric_only=True) |
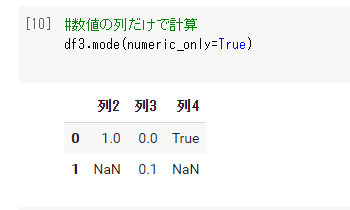
列1は文字列なので無視されています。
dropnaの役割
|
1 2 |
#NaNを無視 df3.mode(dropna=False) |
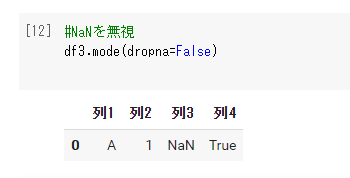
デフォルト(dropna=True)ではNaNを無視しますが、Falseにすると最頻値としてみなされることがあります。
まとめ
今回は平均値、中央値、最頻値の求め方をまとめました。
簡単な関数なのですぐに使えると思います。
参考になれば幸いです。
関連記事
この記事ではPythonのpandasでDataFrameの最大値や最小値を求める方法を解説していきます。 後半には日付データに関することも書いています。 以下のDataFrameを使います。 import pandas[…]